Spatial Experimental Design

Single Nucleus Multiome Experimental Design

Single Nucleus Multiome Experimental Design
Plant leaf intercellular space provides a nutrient-rich and heterogeneous niche for microbes that critically impacts plant health. However, how individual plant cells respond to heterogeneous microbial colonization remains largely elusive. Here, by time-resolved simultaneous single-cell transcriptome and epigenome profiling of plants (Arabidopsis thaliana) infected by virulent and avirulent bacterial pathogens (Pseudomonas syringae), we present cell atlases with gene regulatory logic involving transcription factors, putative cis-regulatory elements, and target genes associated with disease and immunity. We also identify previously uncharacterized cell populations with distinct immune gene expression within major developmental cell types. Furthermore, we employ time-resolved spatial transcriptomics to reveal spatial heterogeneity of plant immune responses linked to pathogen distribution. Integrating our single-cell multiomics and spatial omics data enables spatiotemporal mapping of defense gene regulatory logic with pathogen cells. Our study provides a molecularly-defined spatiotemporal map of plant-microbe interaction at the single-cell resolution.
If you have any trouble exploring our datasets using the CellxGene Gateway, visit here
Notice: when accessing larger datasets, it may take several minutes to load the dataset


Access the preprint at:

After clicking on an experiment to browse with cellxgene:
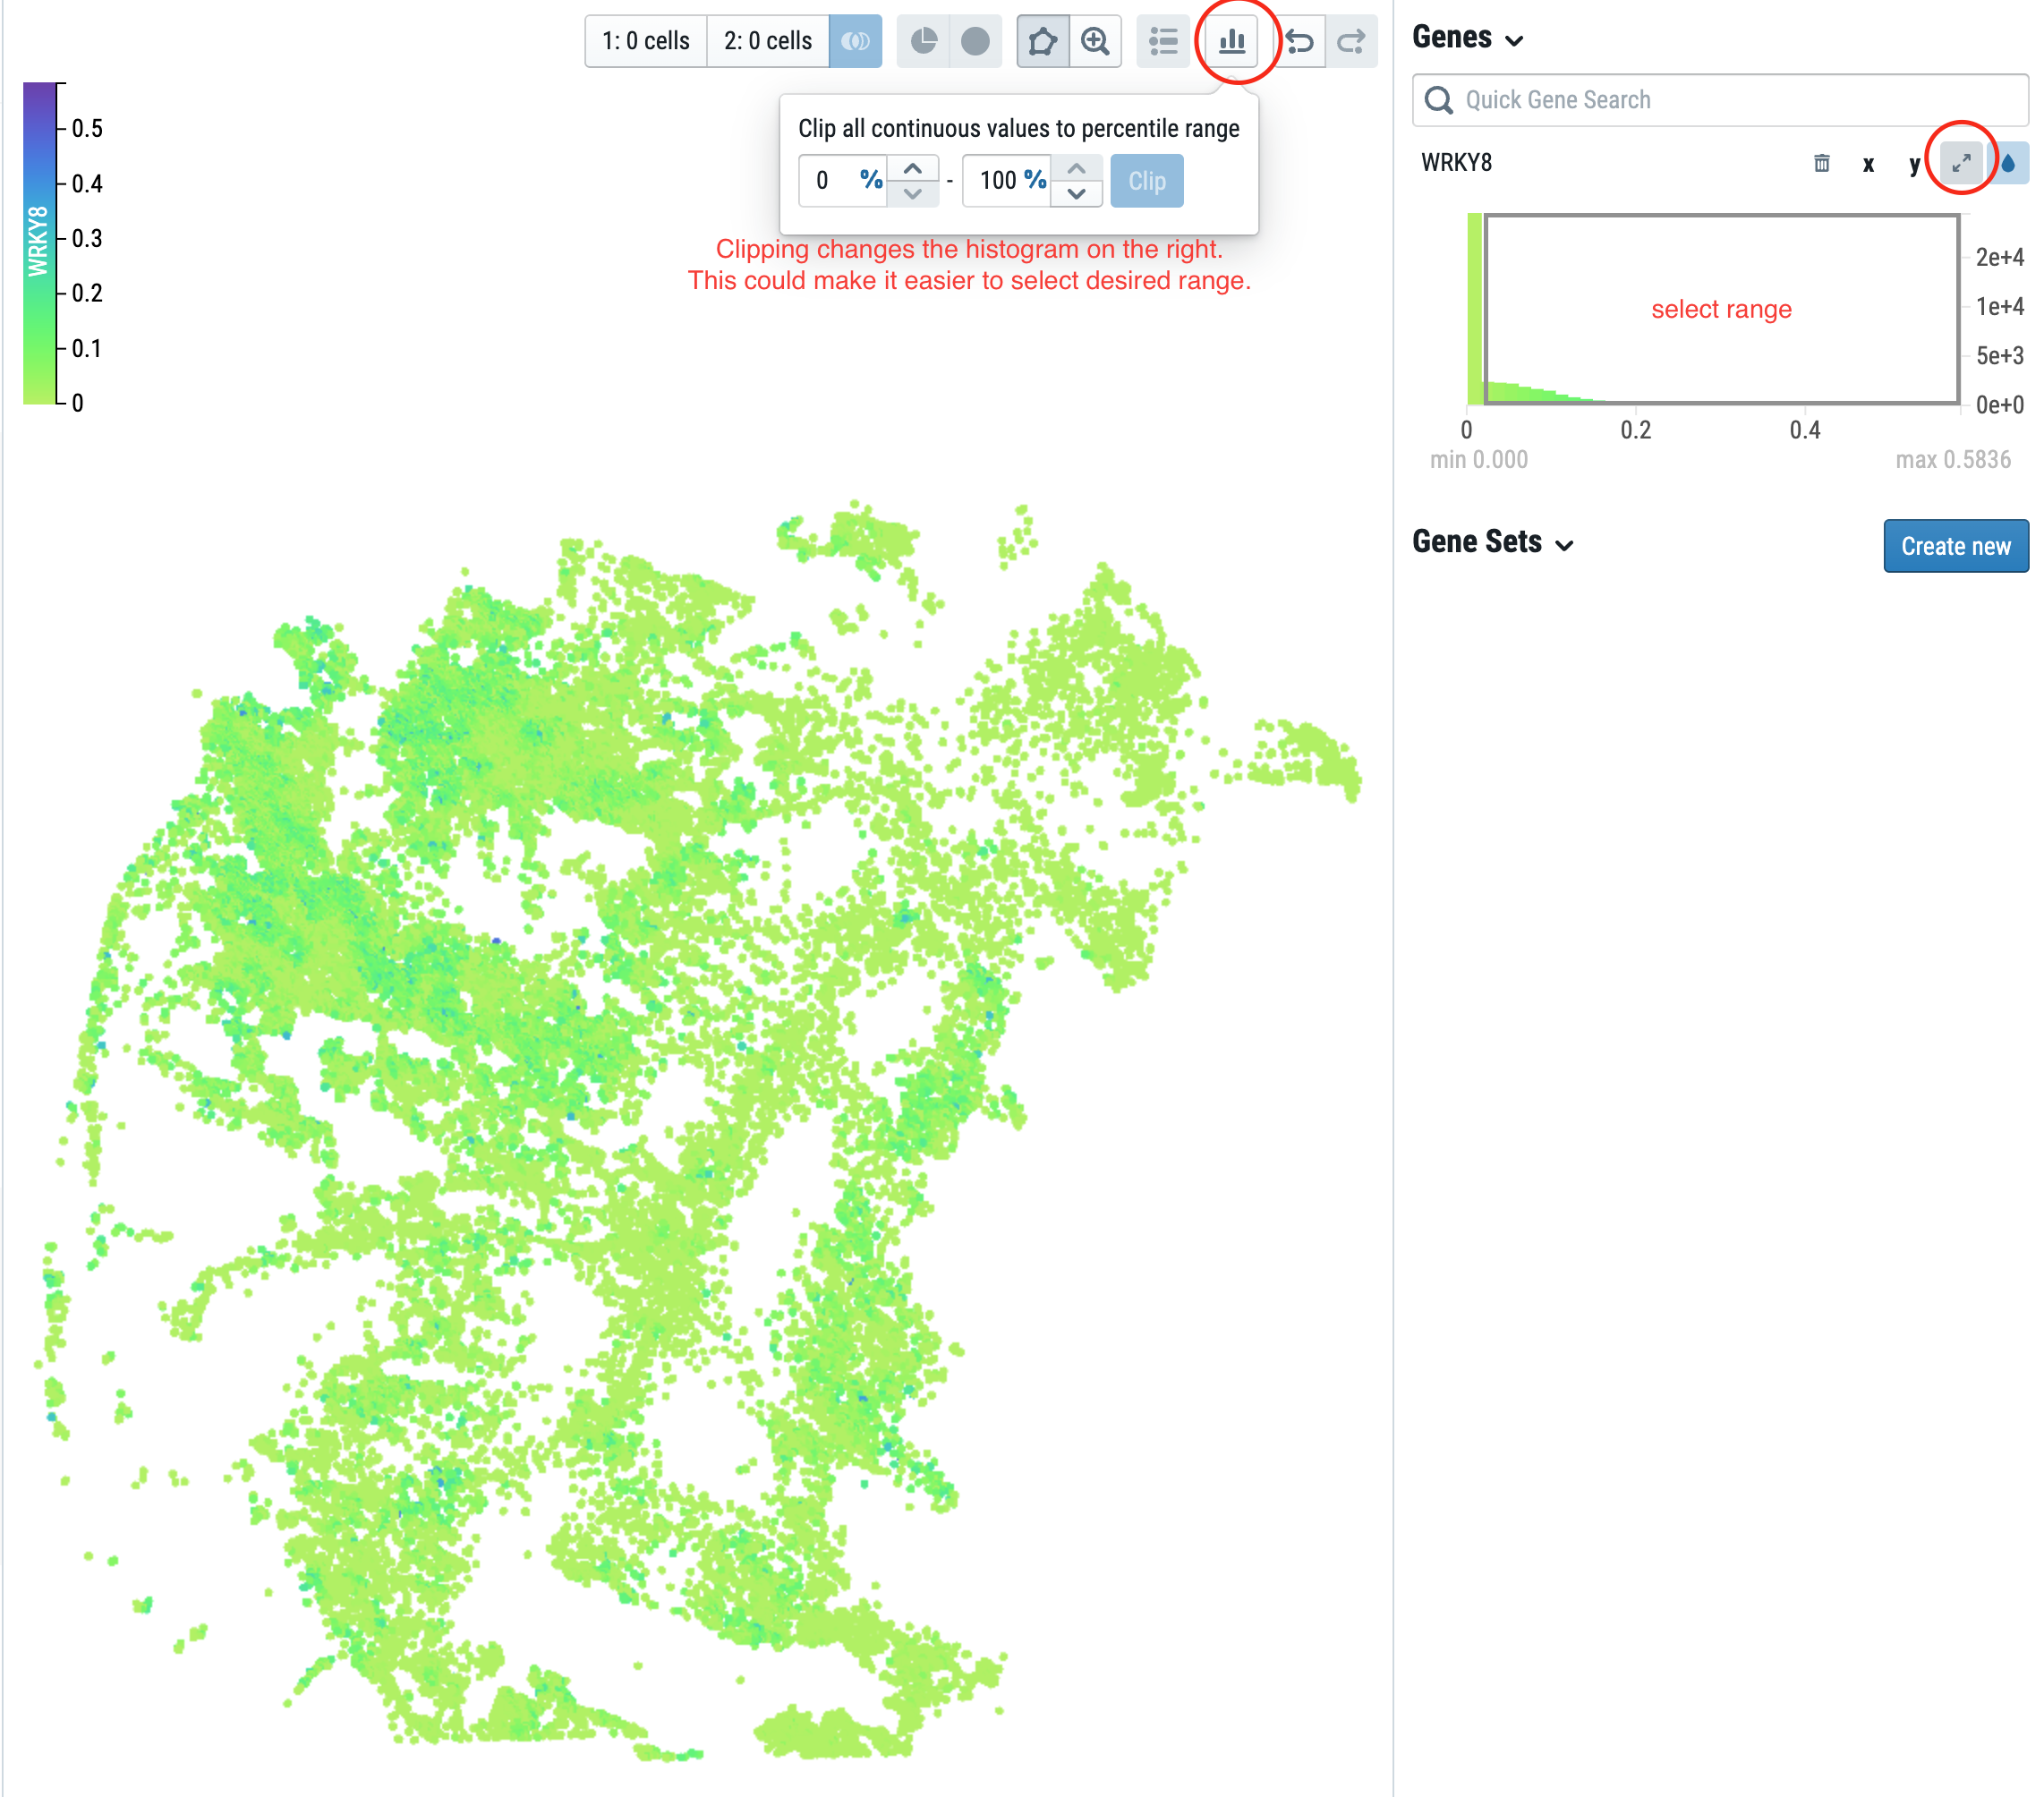
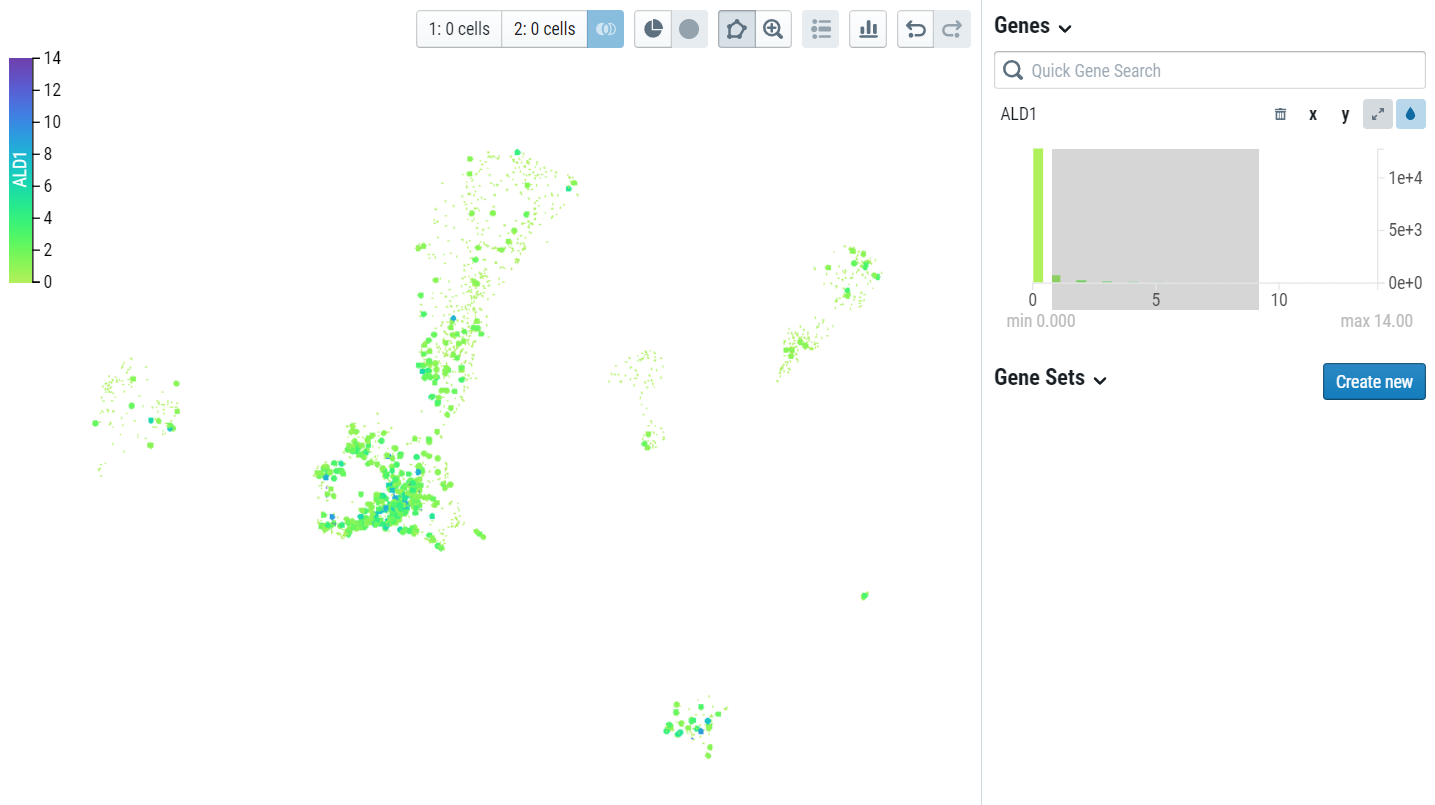
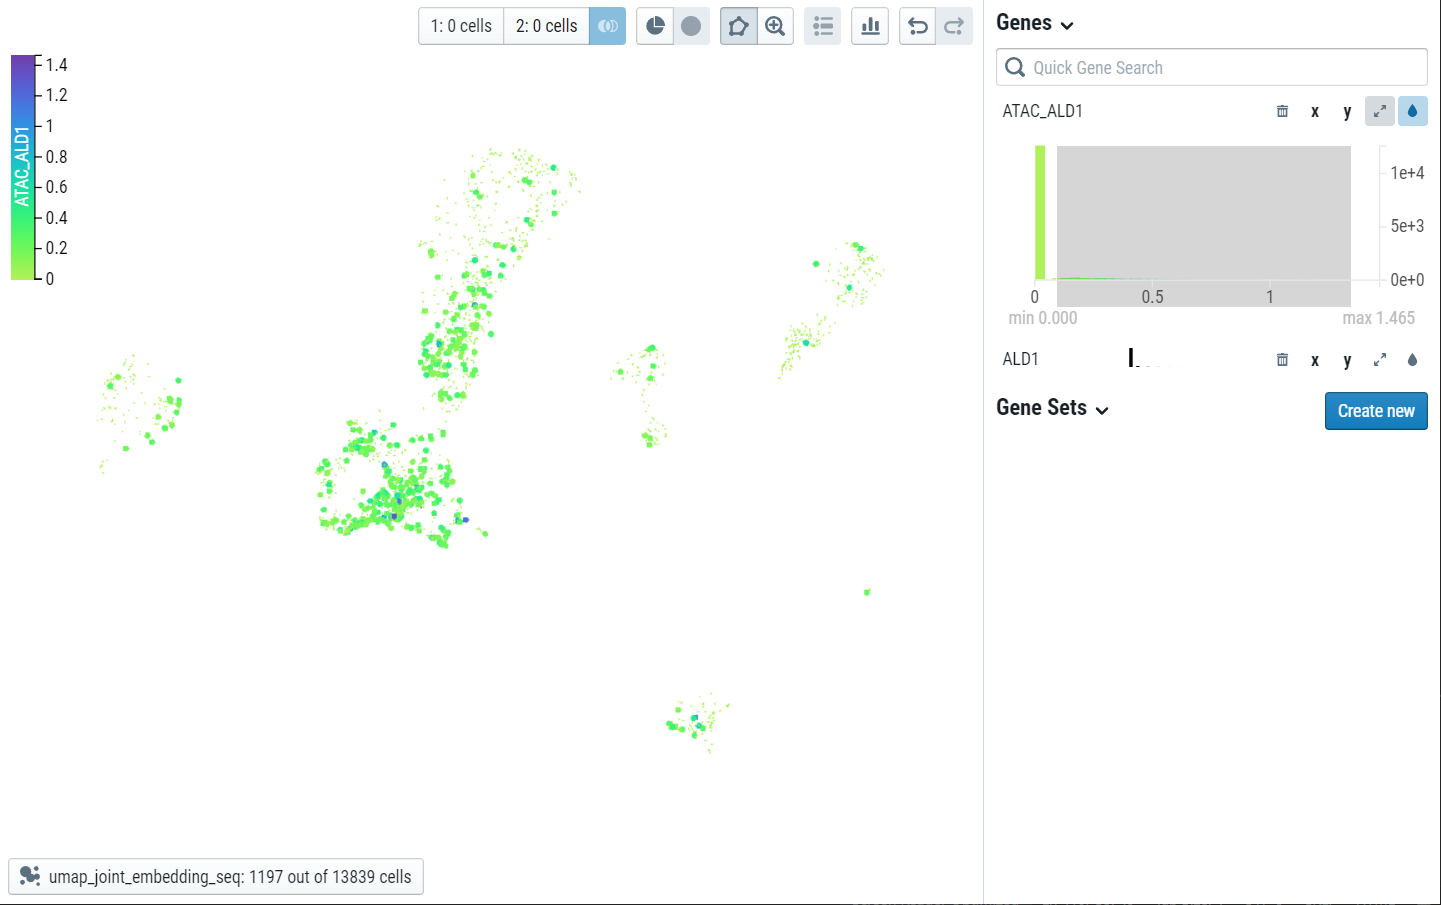
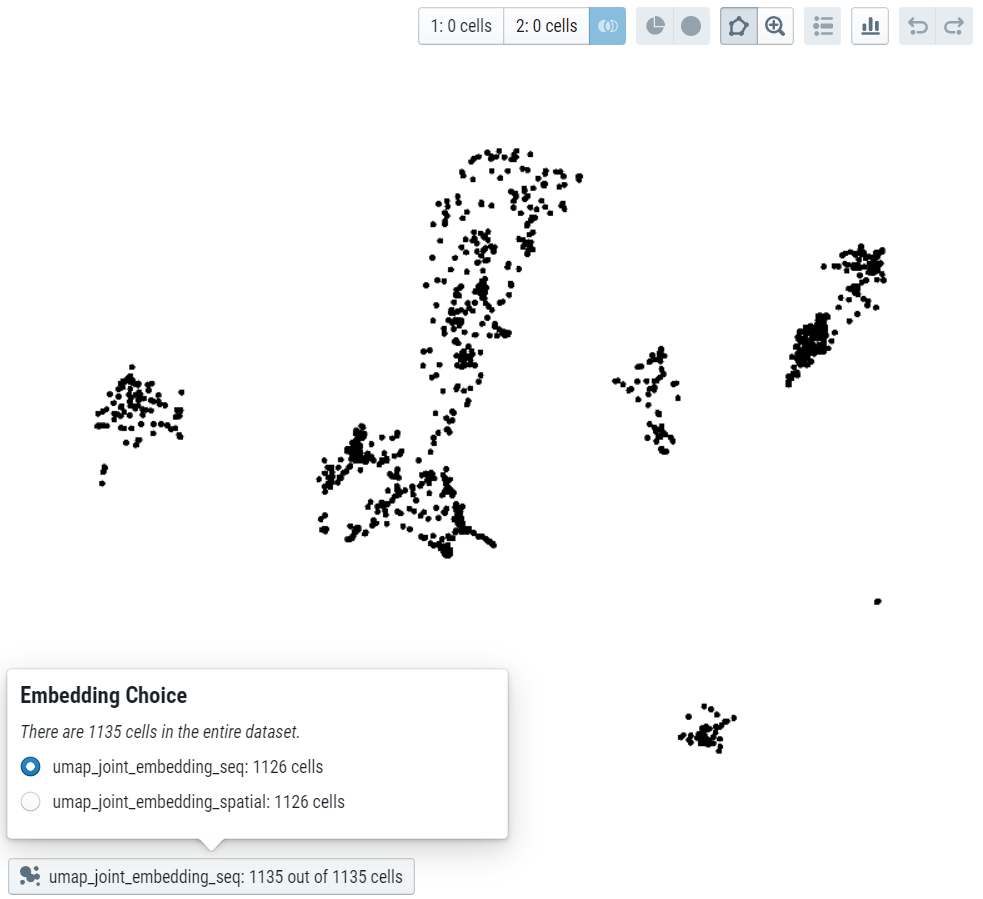
For in-depth CELLxGENE instructions visit CELLxGENE
Raw sequencing data, processed data, and imaging data are available by request.
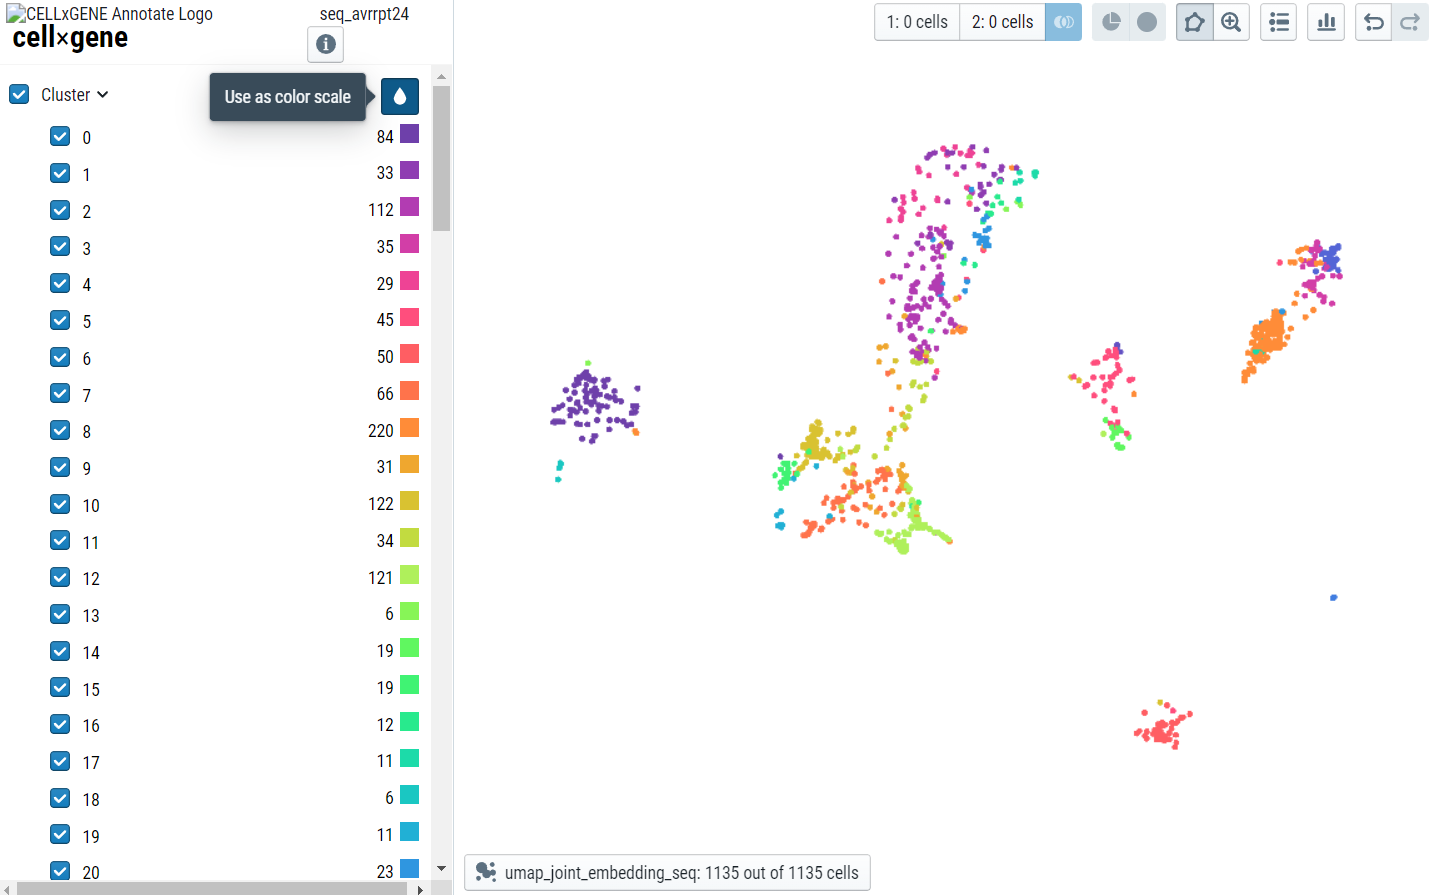
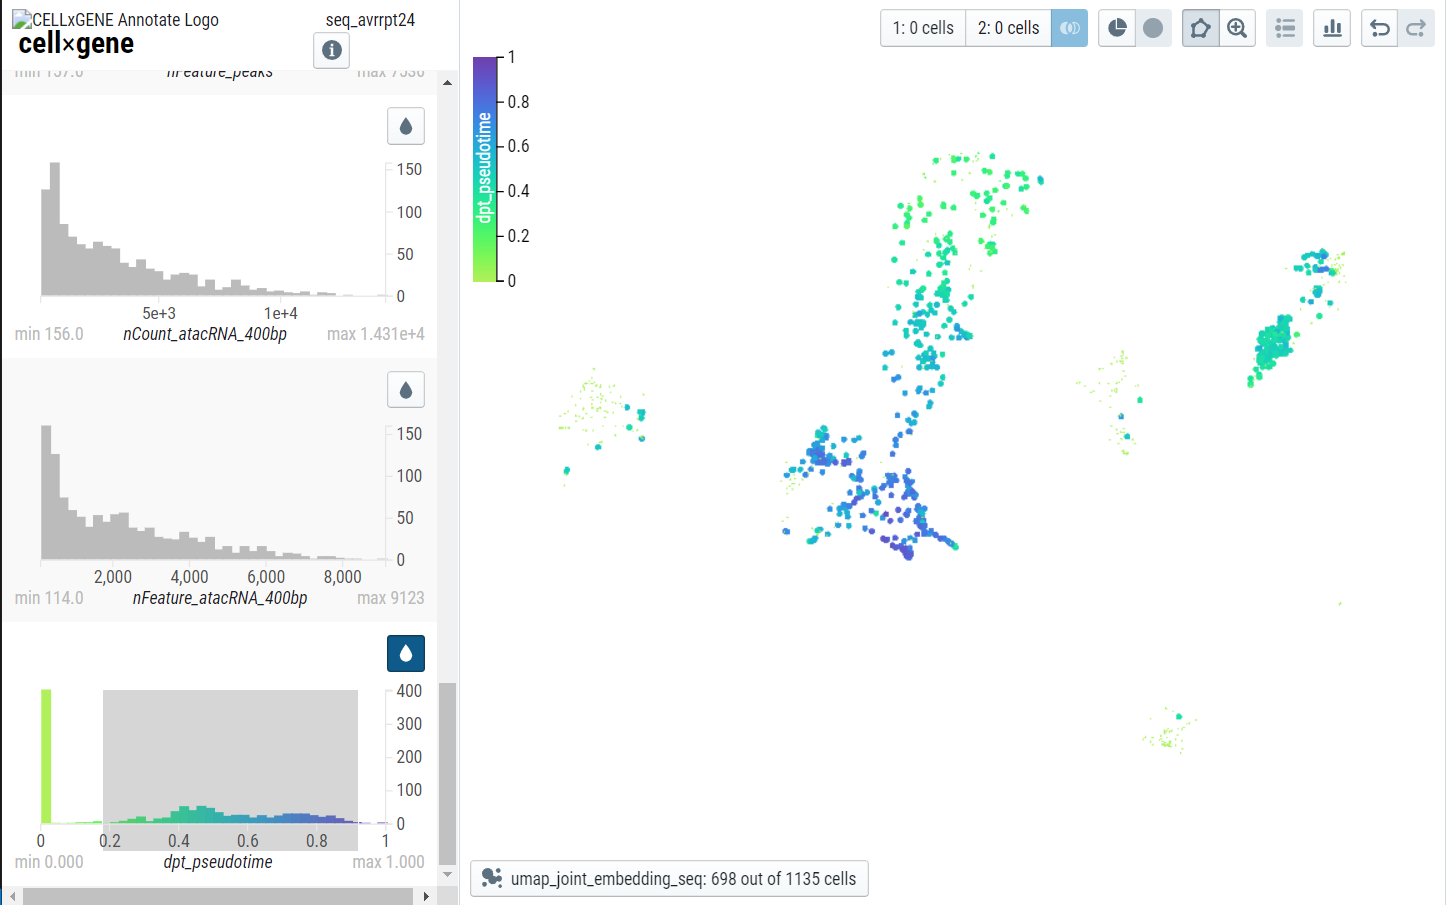
Interactive data browsing utilizes CELLxGENE
Dataset serving utilizes CELLxGENE-gateway
This spatial-temporal Arabidopsis pathogen atlas is maintained by Alexander Monell and Tatsuya Nobori
12-03-2023 Website Launched.